0%
Service SLA
Demonstrative · goal ≥ 90%
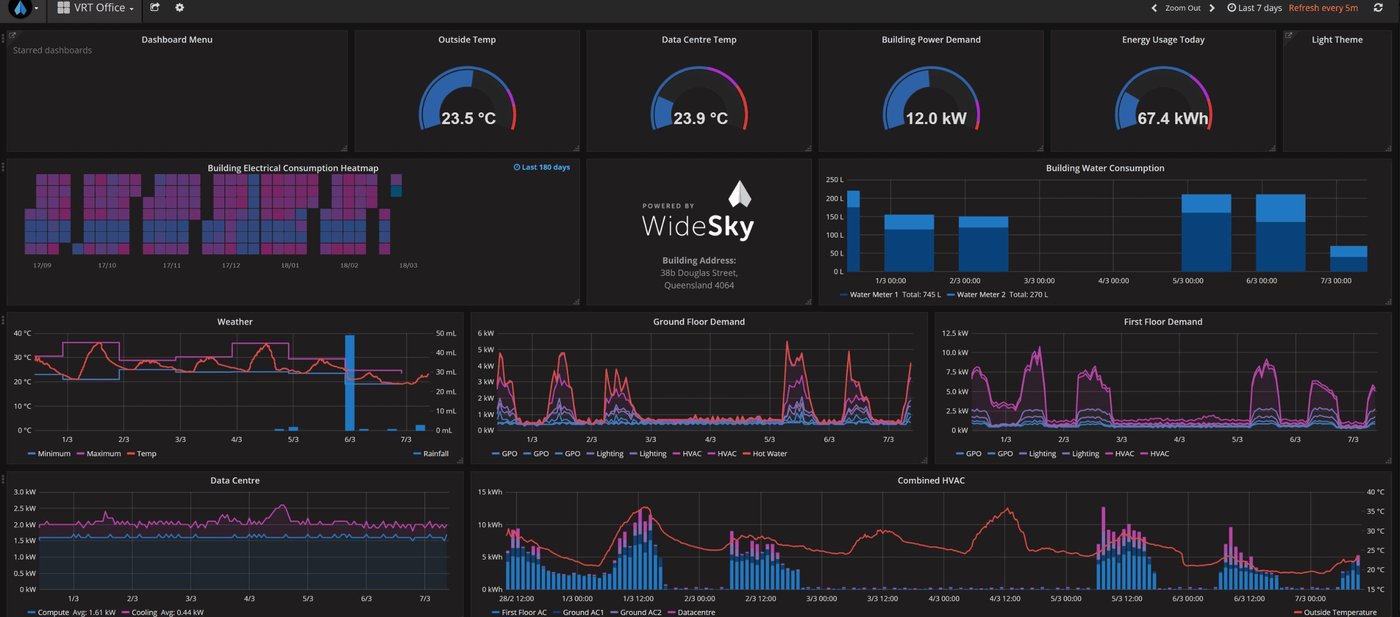
Track volume, SLA, satisfaction and service evolution.
Visibilidade executiva para acompanhar resultados — dados demonstrativos em movimento.
Demonstrative · goal ≥ 90%
Demonstrative · cumulative
Demonstrative · goal ≤ 1 business day
Demonstrative · goal ≥ 4.0 out of 5.0
Demonstrative · to be fed by the Movidesk integration
Demonstrative
Demonstrative · 2026
Painel preparado para exibir dados reais — os valores acima são demonstrativos e não representam resultados efetivos do CSC até a ativação da integração com o Movidesk.